Data is the heartbeat of every asset-intensive organization. Having the right data is one thing, but understanding the data and being able to see the bigger picture is just as important. For your data to work for you, maintenance technicians need to understand what the data is saying. Measuring asset performance and identifying key performance indicators are a significant aspect of maintenance planning. How will you know what to continue, discontinue, or improve on for future maintenance without your data giving you an accurate representation of your assets?
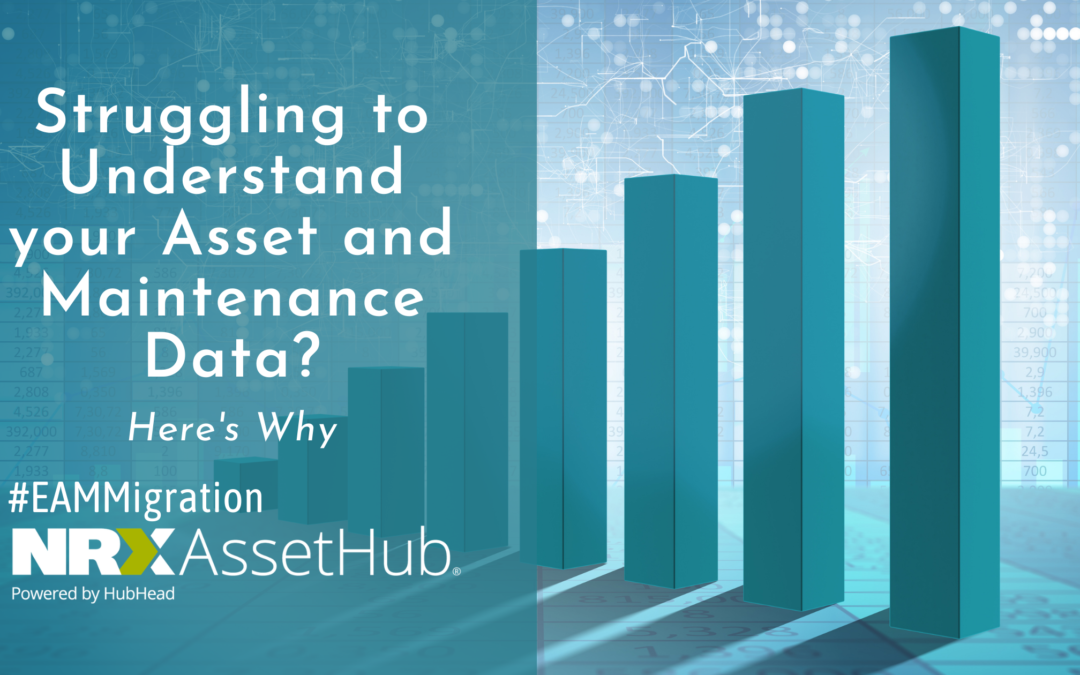
There are many ways for an organization to present their data in a visual format. It could include graphs, diagrams, charts, maps, etc. Presenting data in a visual format creates bite sized information that is easier to interpret. In addition, it becomes easier to identify patterns, leading to a quicker and easier decision making process.
Visualizing your data is an easy way to better understand your data and quickly identify the performance indicators needed for an accurate and holistic assessment. It allows maintenance teams to better identify which areas need improvement. It can also reduce wrench time because maintenance staff don’t have to spend time scrolling through long, tedious of lists data looking for information. Everything is right there in front of them.
Visualization can also make your data more interactive, an example being exploded parts diagrams. This helps reduce errors, prevent the wrong parts from being ordered, and maintain efficiency with maintenance planning.

Prepare your asset data for visualization
Data visualization may seem insignificant. But it is vital to smooth business operations. Without visualizing your data, you may only be seeing the tip of the iceberg. However, to see the bigger picture, organizations need access to the deeper and perhaps more complex layers.
NRX solutions provide users with features for visualizing, editing, building, and organizing their asset and maintenance data. If you would like to learn more about our solutions, don’t hesitate to book a demo and our team would be happy to help!
Your EAM is Only as Good as the Data you Feed it
Visualization is the Key to Success
Dr-EAMs can come true with better visualization
Share this article


